>>Read the complete, in-depth July 2026 Edition HERE
KEY HIGHLIGHTS
CORN
US 2025/26 corn ending stocks were cut by 125 million bushels to 2.020 billion in the July WASDE report, 50 million below expectations.
Feed usage rose 150 million, while usage for ethanol was cut 25 million.
2026 US corn production at 16.0 billion bushels was in line with expectations and down 1.021 billion from 2025.
Trendline yield was left unchanged at 183 bushels per acre, the second highest ever.
SOYBEANS
The July WASDE report showed US 2025/26 soybean ending stocks were cut by 10 million bushels to 330 million on higher exports. This was 10 million below expectations.
2026 US production at 4.475 billion bushels was 15 million above expectations.
Trendline yield held at a record 53 bushels per acre.
New crop exports were increased by 30 million bushels.
WHEAT
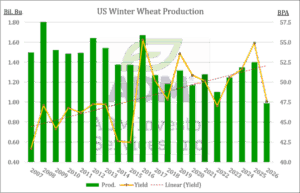
US 2026 all wheat production was lowered by 7 million bushels to 1.536 billion in the July WASDE report. Lowest since 1970.
Average yield was raised to 47.9 bushels per acre in July, while harvested acres were lowered by 800,000 per the June Acreage report.
Winter wheat production at 990 million bushels was down 40 million bushels and the lowest in 51 years.
HRW production was down 26 million bushels to 471 million, and SRW was down 13 million to 287 million.
COCOA
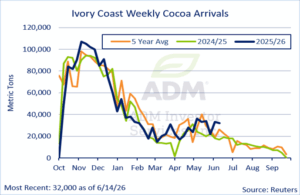
A Reuters story on July 10 citing four pod counters and five major exporters in Ivory Coast indicated that the nation’s 2026/27 main crop could drop more than 10% because of excess rains earlier this season.
The consultancy Oxford Economics said initial estimates suggest the nation’s 2026/27 cocoa harvest overall could fall by roughly 20%. The said crop surveys showed more than 20% of flowers and cherelles had died between May and June due to the heavy rainfall.
The cooler conditions that accompanied the excess moisture may have also encouraged the spread of black pod disease.
Good growing weather January and May helped produce unusually large beans and high bean counts of around 110 beans per 100 grams versus an average of 130-160. This benefits the current mid-crop, but it could also mean the trees are exhausted and set to produce less next season.
COFFEE
There has been a growing sense of concern over El Nino, which at this point appears to be having a direct effect on robusta production in southeast Asia, starting with Indonesia but extending to the world’s larger grower, Vietnam.
The US CPC recently gave an 81% chance of a very strong El Nino this fall, which would rank among the strongest on record.
Recent drier conditions in Brazil are welcome following some extremely heavy rains in June that slowed the harvest and damaged some of the crop. The market had been expecting a very strong crop this year that would help alleviate tight global supplies of arabica coffee. The interruption in the harvest appears to have made the situation even tighter. ICE certified arabica stocks have fallen to their lowest level since February 2024.
COTTON
The July USDA supply/demand report showed US 2026/27 cotton production at 13.70 million bales, which was above the average trade expectation of 13.42 million going into the report and up from 13.30 million in the June update.
Planted area was raised to 9.85 million acres, which was in line with the June 30 Acreage Report, and the abandonment rate at 23.5% was basically unchanged from June’s 23.4%. However, average yield was raised to at 872 pounds per acre from 866 in June. (Some may have expected USDA to reduce yield because of the dry conditions in Texas, but that did not happen.)
US 2026/27 ending stocks came in at 4.10 million bales versus 3.77 million expected and 3.70 million in June. This put the stocks/use ratio at 29.5% versus 26.6% in June, 30.5% last year, and a five-year average of 27.1%.
SUGAR
In late June, October Sugar fell to its lowest level since February but then found support over the following session from concerns over the beet crop in Europe, as extreme heat and dry conditions have put the crop in jeopardy. The European Union is the third-largest producer of sugar in the world at an estimated 14.4 million metric tons for 2026/27, behind Brazil at 42.5 million and India at 33.6 million. As of this writing the opportunity for relief looked very limited.
Concerns remain about El Nino’s potential impact on global production, especially India and Thailand. (Thailand is the fifth-largest producer at 9.5 million tons.) India is experiencing a below normal monsoon, and as of this writing the southern part of the nation was already too dry. Southern Thailand was seeing below normal rainfall, but water supply for irrigation was still favorable.
As of June 1, Brazil Center-South sugar production had fallen behind year ago and five-year average levels, while ethanol production held above those levels. Heavy rains in early June are expected to have slowed crush and harvest activity down during the first half of the month.
CRUDE OIL
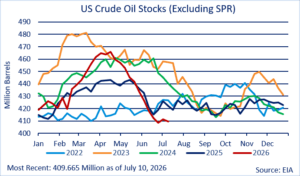
After falling to its lowest level since the start of the US-Iran war, September rebounded off the collapse of the cease-fire agreement of the dispute over Iran’s desire to control the flows through the Strait of Hormuz.
The resumption of the hostilities between the US and Iran have resulted in another de-facto closing of the strait, with Iran attacking or threatening to attack tankers and the US reestablishing its blockade. At the time of this writing, the US was attempting to degrade Iran’s ability to interrupt shipping.
To make matters worse, the Houthis in Yemen have stepped up attacks on Saudi Arabia, and there were reports that Iran was encouraging them to block the Bab el-Mandeb gateway that connects the Red Sea and the Gulf of Aden, which is other the major outlet for Mideast crude to Asia. Since the initial blockage, the Saudis’ ability to pipe more oil to the Red Sea was one of the factors that helped crude oil supply avoid some of the worst-case scenarios.
Gasoline and diesel prices have shown more impressive gains than crude oil, as global product supplies have been slower to recover.
NATURAL GAS
June Natural Gas broke below a nine-week consolidation in July to trade to its lowest level since August 2021. The nearby contract fell to its lowest level since April.
The Natural Gas Pipeline Company of America has removed transportation restrictions for fuel moving through East Texas and southwest Louisiana, which will allow more supply to flow to the benchmark physical gas contract in Erath, Louisiana (the location of the Henry Hub), among others. This is expected to allow more supply to the main deliverable point for the CME futures contract.
The Freeport LNG export terminal in Texas started “major maintenance Turnaround work” on July 10, which is expected to limit the amount of offtake to LNG export facilities over the next several weeks. The work is expected to last into late August.
LIVE CATTLE
Beef prices performed in their typical seasonal manner in June and July, but there are changes afoot. Prices rallied into the July 4th holiday as usual and the declined once the holiday was over. Beef demand tends to drop during the heat of the summer as consumers shift to fast-cooking items and avoid using the oven. However, in 2025 and more so in 2026, the shift to lower-priced beef items was also due to extremely high beef prices.
According to the Bureau of Labor Statistics, by the end of June ground beef prices were up 13% from 2025, and steaks were up 16%. On June 25, the choice boxed beef cutout reached $400.94/cwt, but as of this report on July 15, it had fallen to $373.95.
Beef prices have seen added pressure from the 11% increase in beef imports this year.
LEAN HOGS
The hog market has seen some improvement over the past month.
June Lean Hogs expired at $92.52 on June 12, and the July contract went off the board on July 15 at $95.17.
Year to date pork production as of July 11 was +0.8% from 2025, and the federal year-to-date hog slaughter was -0.2%. Pork production has increased due to heavier hogs, which are up 6 pounds from the same period in 2025.
STOCK INDEX FUTURES
Stock index futures experienced choppy, two-way price action over the past month amid heavy pressure in the tech sector, particularly in semiconductors and AI-related names. The tech-heavy Nasdaq and the S&P 500 have faltered since mid-June, while the Dow notched a stable move upwards as industrials outperformed tech. Geopolitical risk remains in play as the US-Iran memorandum of understanding has seemingly collapsed and the two sides trade strikes. The US recently announced a naval blockade of Iran.
Recent price action around major chip names has underscored how fragile tech rallies have become. Rising concerns over heavy capex and the sustainability of AI-driven valuations also remain present. Several large tech companies have been tapping the bond market to raise cash, fueling concerns that the sector may be spending too much on AI infrastructure and that debt is too high. The fundamental question for the indexes, mainly the tech-related momentum trade, is whether or not capex requirements outrun earnings estimates and demand as investors are try to price outcomes they cannot yet observe.
CURRENCIES
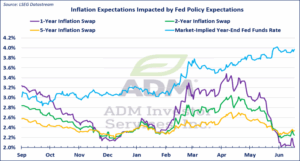
The dollar has gained sharply against most of its peers, thanks to a collapse in the US-Iran MOU and a sharp repricing in Fed policy expectations. Despite June’s CPI print, which alleviated some fears of broad-based inflation, core inflation still rests above the Fed’s 2% target, and rhetoric out of the Fed continues to support ideas that policy could move towards tightening this year. Money markets are fully priced for one hike in late 2026.
The EUR/USD sat near $1.16 in mid-June, and it has seen a modest decline since, as geopolitical developments favored the dollar, while Fed rate hike expectations shored up favorable interest rate differential. President Lagarde has retained a hawkish bias. The current inflation environment across the globe favors tighter monetary policy, though inflation in the eurozone has been cooling since April.
INTEREST RATES
Treasury yields have been at the mercy of Fed rate hike expectations and the oil market ever since the conflict in Iran began and more recently with Kevin Warsh taking the helm at the Fed.
The 2-year yield remaining above 4% is the strongest signal that policy is likely to move upwards.
While June’s inflation data appeared rather benign given the circumstances, supercore inflation (services ex-shelter) at 3.15% remained above the level consistent with a return to the 2% target.
GOLD
Gold prices have continued to trend downwards since mid-June, as the market navigates a challenging macroeconomic environment in which higher Treasury yields, a stronger dollar, and a hawkish repricing of Fed rate expectations have weighed on prices.
With core CPI at 2.6%, and well over the Fed’s 2% target, the market’s response has been to price-in Fed tightening. This means that the opportunity cost of holding a non-yielding asset like gold has increased sharply. The 10-year real yield, as measured by the TIPS market, remains a dominant source of pressure on gold prices.
Gold is still trading as a pure macro asset, with unusually tight inverse relationships to the dollar and US real yields keeping a lid on prices.
COPPER
COMEX copper futures have faced choppy two-sided trade since mid-June, falling in the second half of June and paring back some of its losses in July. A stronger dollar has pressured LME prices, and the hawkish-repricing in Fed policy have acted as a headwind as well. Still, fundamentals for copper remain favorable, with lower LME inventory, shipments to the US amid expectations of new tariffs, and broad-demand for AI infrastructure and energy transition expected to underpin demand.
Despite a lack of announcement from US officials on a decision regarding potential tariffs on refined copper, flows to US warehouses continue, as arbitrage opportunities remain. Tariff risk is still present and should not be discounted. COMEX warehouses are above 615,000 metric tons, as they continue their steady increase.
Interested in more futures market commentary? Explore our Market Dashboards here.
Risk Warning: Investments in Equities, Contracts for Difference (CFDs) in any instrument, Futures, Options, Derivatives and Foreign Exchange can fluctuate in value. Investors should therefore be aware that they may not realise the initial amount invested and may incur additional liabilities. These investments may be subject to above average financial risk of loss. Investors should consider their financial circumstances, investment experience and if it is appropriate to invest. If necessary, seek independent financial advice.
ADM Investor Services International Limited, registered in England No. 02547805, is authorised and regulated by the Financial Conduct Authority [FRN 148474] and is a member of the London Stock Exchange. Registered office: 3rd Floor, The Minster Building, 21 Mincing Lane, London EC3R 7AG.
Futures and options trading involve significant risk of loss and may not be suitable for everyone. Therefore, carefully consider whether such trading is suitable for you in light of your financial condition. The information and comments contained herein is provided by ADMIS and in no way should be construed to be information provided by ADM. The author of this report did not have a financial interest in any of the contracts discussed in this report at the time the report was prepared. The information provided is designed to assist in your analysis and evaluation of the futures and options markets. However, any decisions you may make to buy, sell or hold a futures or options position on such research are entirely your own and not in any way deemed to be endorsed by or attributed to ADMIS. Copyright ADM Investor Services, Inc.