Written Commentary

Today’s USDA data was supportive for feed grains with June 1st stocks below expectations for both corn and wheat while wheat acres were well below expectations. Today’s reports were neutral for the soybean complex with both stocks and acres close to expectations. Bean oil was being pressured by speculative selling, heavy deliveries, and record canola acres in Canada. Principal crop acres in the US are down 1.9 mil. from YA to 309.6 mil. a 7-year low as US farmers face negative production margins across a host of commodities. Favorable US weather likely dampened the bullish impact for feed grains.
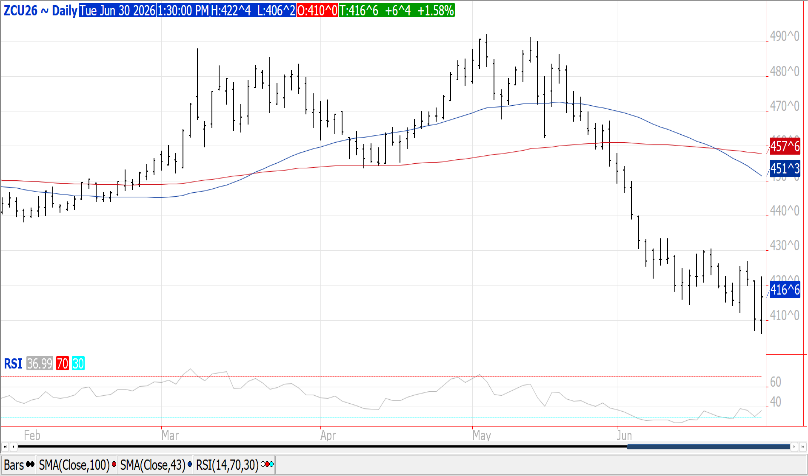
Corn: Prices closed $.05-$.07 higher after surging to double digit gains shortly after the USDA data was released. June 1st stocks at 5.295 bil. bu. would imply March through May usage at a record 3.738 bil. bu. up 6.5% from YA. It would not surprise me if we ultimately see last year’s production lowered a touch. The tighter stocks should work to raise the price floor however with acres still above 95 mil. will likely limit the upside unless US weather becomes more threatening or demand from China emerges.
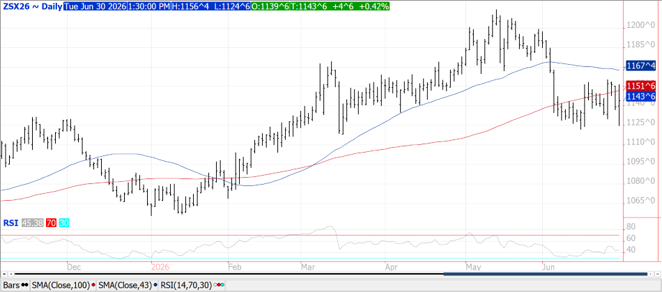
Mixed across the complex with beans prices up $.05-$.08, meal was steady to $1 higher while oil prices plunged 130-230 points. Crush margins were pounded, down another $.34 to $2.87 ½ bu. a 3-month low, while bean oil PV fell to a 2-month low at 52.3%. Also weighing on bean oil was EIA data that showed usage to produce green diesel fell 4.6% in April to 1.224 bil. lbs. falling well behind the pace to reach the USDA forecast of 14.550 bil. lbs. for the 25/26 MY. To reach this forecast usage May through Sept will need to average 1.442 bil. lbs. US weather and Chinese demand will likely dictate whether Nov-26 can break through resistance at $11.60 or violate support near $11.20.
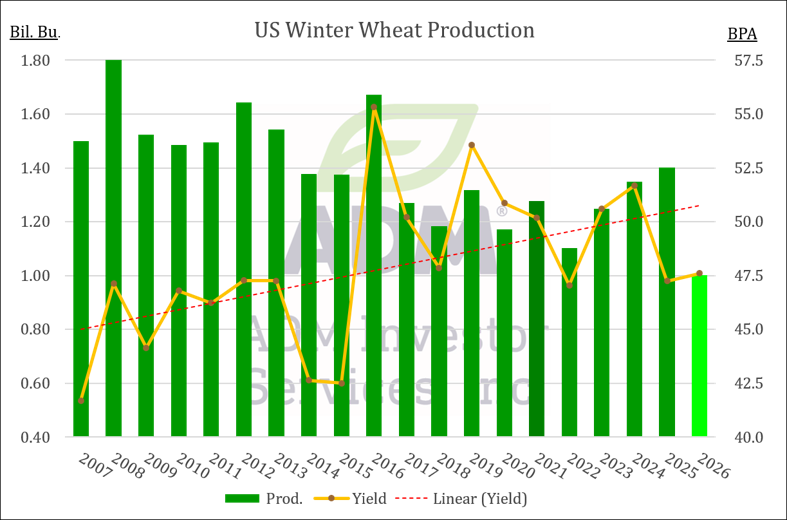
Prices ranged from $.06-$.11 higher led by KC and CGO futures. Strength was driven by a huge downward revision to planted acres.
Risk Warning: Investments in Equities, Contracts for Difference (CFDs) in any instrument, Futures, Options, Derivatives and Foreign Exchange can fluctuate in value. Investors should therefore be aware that they may not realise the initial amount invested and may incur additional liabilities. These investments may be subject to above average financial risk of loss. Investors should consider their financial circumstances, investment experience and if it is appropriate to invest. If necessary, seek independent financial advice.
ADM Investor Services International Limited, registered in England No. 02547805, is authorised and regulated by the Financial Conduct Authority [FRN 148474] and is a member of the London Stock Exchange. Registered office: 3rd Floor, The Minster Building, 21 Mincing Lane, London EC3R 7AG.
A subsidiary of Archer Daniels Midland Company.
© 2026 ADM Investor Services International Limited.
Futures and options trading involve significant risk of loss and may not be suitable for everyone. Therefore, carefully consider whether such trading is suitable for you in light of your financial condition. The information and comments contained herein is provided by ADMIS and in no way should be construed to be information provided by ADM. The author of this report did not have a financial interest in any of the contracts discussed in this report at the time the report was prepared. The information provided is designed to assist in your analysis and evaluation of the futures and options markets. However, any decisions you may make to buy, sell or hold a futures or options position on such research are entirely your own and not in any way deemed to be endorsed by or attributed to ADMIS. Copyright ADM Investor Services, Inc.