>>Read the complete, in-depth April 2026 Edition HERE
KEY HIGHLIGHTS
CORN
The WASDE report showed the 2025/26 average farm price increased at $4.15/bushel, an increase of 5 cents.
Urea prices have surged 55% since late February.
Expect July Corn to be rangebound between $4.50 and $4.80.
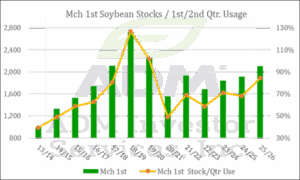
SOYBEANS
USDA increased the 2025/26 average farm price by 10 cents per bushel to $10.30.
July Soybeans may hold between $11.25-$12.00 until the Trump/Xi meeting in mid-May.
With timely spring plantings and no additional Chinese demand, spot prices are likely to retest $11.00 by late May.
Slowed harvest in Argentina has benefited US meal demand.
WHEAT
USDA raised the average US farm price by 5 cents per bushels to $5.00 for the 2025/26 marketing year.
Drought in the southwest plains is providing support for KC HRW futures.
US wheat has become less competitive for global importers.
Price floor for Chicago July Wheat is up to $5.50, and it overvalued above $6.25.
COCOA
First-quarter 2026 European cocoa grind came in at 325,895 metric tons, down 7.8% from the first quarter of 2025. This was a somewhat larger decline than expectations calling for -6%.
First-quarter Asian grind came in at 225,503 metric tons, up 5.2% from the first quarter of 2025. Prior to the report, the trade had been looking for a decline.
First-quarter North American grind came in at 106,087 metric tons, down 3.8% from the first quarter of 2025.
This brought the total grind for the three regions to 655,485 metric tons, down 3.1% from 676,259 in the first quarter of 2025.
COFFEE
Safras & Mercado revised Brazil’s 2026/27 coffee crop to 75.65 million bags, up 4.65 million from their previous forecast and 17% above 2025/26. They credited good rains and milder temperatures. This was not a big surprise, as forecasts for Brazilian production have been trending higher.
Safras & Mercado put Brazil arabica production at 49.95 million bags in 2026/27, +29% from 2025/26. This is the “on year” in Brazil’s biennial crop cycle.
Brazil robusta output was forecast at 25.7 million bags, -1.2% from 2025/26.
In February, Conab forecast Brazilian 2026/27 arabica production at 44.09 million bags and robusta at 22.10 million, for a total of 66.19 million.
SUGAR
The US Climate Prediction Center has given a 61% chance for El Niño to emerge during the May-July period, which is earlier than previous forecasts calling for a late summer arrival.
El Niño has been known to bring hot and dry conditions to India and Thailand, which could lower production for both countries for the 2026/27 year.
India was the second largest sugar producer in the world in 2025 after Brazil. Thailand was the second largest exporter after Brazil.
The India Meteorological Department recently forecast a below average monsoon for 2026, with rainfall expected to come in around 92% of the long-period average (LPA) versus “normal” rainfall between 96% and 104% of the average. Having adequate monsoon rainfall is critical for crops.
COTTON
In just two months, July Cotton has rallied from a contract low of 64.83 to as high as 80.49, a 24% gain inside eight weeks.
High oil prices due to the closure of the Strait of Hormuz has been cited as a factor in the rally, but the likely culprit has been dry conditions across the US cotton belt.
As of April 14, an area representing around 97% of US cotton production was experiencing drought. This was up from 89% on March 17 and 22% a year prior.
This picture could start to change, now that the transition from the La Niña to ENSO-Neutral has been completed. (La Niña tends to bring drier than normal conditions to the southern US. As of April 20, The National Weather Service’s 6-10 and 8-14 day maps showed above normal chances of rain for the US cotton belt.
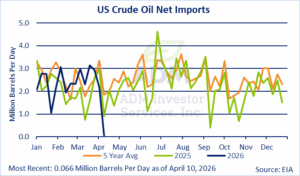
CRUDE OIL
Nearby crude oil rallied on March 9 to its highest level since the start of the Russia/Ukraine war in reaction to Iran’s effective closure of the Strait of Hormuz. It reached its second highest level since putting in an all-time high of $144 in 2008. The June contract had a wide, $28.74 range that day, putting in a high of $104.34 but closing $17.67 off the high at $86.67. Since then, the market has bounced back and forth, as on again/off again peace talks between the US and Iran have raised then dashed hopes of an agreement that would reopen the strait.
The US began a blockade against Iranian the week of April 13. By Friday of that week Iran announced that the Strait had been reopened, but they closed it again the following day after the US refused to lift the blockade.
Roughly 20% of global crude oil shipments travel through the strait.
Shipping and refining activity around the Gulf has ground to a halt. Damaged infrastructure could take several years to restore.
NATURAL GAS
June Natural Gas continued its decline into April despite the closure of the Strait of Hormuz.
The Strait’s closing is believed to have cut off roughly 20% of global LNG supply, but this has not supported US prices because the US has ample domestic production and is already exporting as much as current logistics allow.
As of April 21, average gas flows to the nine big US LNG export plants were averaging 18.9 billion cubic feet per day for the month, up from 18.6 bcfd in March and above the record high 18.7 bcfd from February.
The new Golden Pass LNG processing plant is coming on line in Texas, and it is expected to eventually process 800 million cubic feet per day.
LIVE CATTLE
The US federal cattle slaughter continues to drop relative to 2025. As of April 11 cumulative slaughter for 2026 was down 10% from a year ago, a decline of 846,567 head. For the same date in 2025, cumulative slaughter was down 5.4%, a decline of 482,821.
In mid-April, the choice boxed beef cutout was valued at $380.90/cwt, 44 cents below the select cutout. A year prior, choice was valued at $334.22, $20.60 above select.
Prime and choice cattle currently represent 88.3% of the total slaughter, with select at 8.9%. In 2025 85.3% were rated prime/choice and 11.5% select 2025. Cattle weights are averaging 43 pounds higher this year.
Demand has increased for select beef, which is needed to blend with prime/choice products for ground beef.
LEAN HOGS
The March Quarterly Hogs and Pigs Report was neutral, with market hog inventory estimated to be up 1% from the previous year.
US federal hog slaughter has seen a slow increase this The January slaughter was down 3.6% from 2025, by February year to date slaughter was down 2.1%, and by March it was down 1.0%.
Hog inventory is expected to increase from May through July. The December 2025-February 2026 pig crop was up 1% from last year, and the March-May intended farrowings are estimated to be +1%. However, June-August farrowing intentions are estimated to be down 2%.
The USDA is forecasting US pork exports to be up 3.1% in 2026. With global pork production forecasted at 120.2 million metric tons in 2026 (only a 0.6% increase), global competition will be in check.
STOCK INDEX FUTURES
Stock index futures staged a dramatic V-shaped recovery over the past month. From mid-March through March 30, equities sold off sharply as the Iran-US conflict escalated, which pushed energy prices higher and sparked surge in CPI 3.3% YoY in March. Then the April 7 ceasefire ignited a powerful rally that erased all losses and sent the S&P hit an intraday record on April 15. The S&P 500 has gained roughly 5.8% since mid-March, with the Nasdaq up 8.4%, and the Dow up 4%.
The Dow held up better than the tech-heavy Nasdaq during the selloff, as investors rotated out of growth stocks and into defensive names, but investors ultimately favored dollar liquidity over risk assets.
The recovery phase was fueled by the two-week ceasefire that after President Trump pause scheduled strikes on Iranian facilities. The rally accelerated in the second week of April as ceasefire talks fueled speculation of an end to hostilities.
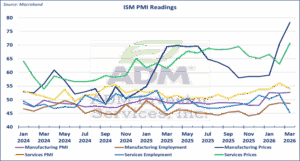
ISM Manufacturing PMI rose to 52.7 in March, up from 52.4 in February, marking the third consecutive month of expansion. The Prices Index surged to 78.3, its highest since June 2022, reflecting the pass-through of energy costs. ISM Services PMI came in at 54.0, with the Prices Index jumping to 70.7, its highest since October 2022, underscoring inflation pressures across the economy.
CURRENCIES
The June Dollar Index experienced a meaningful decline over the past month, falling from 100.500 on March 31 to 97.425 on April 17. The selloff accelerated as the ceasefire unwound safe-haven flows that had supported the dollar. As risk appetites improved and equities surged, the dollar came under more pressure.
There is a case for the dollar to resume its downtrend once the US/Iran conflict is officially over. The dollar has lost the interest rate differential support it once drew from hawkish Fed expectations. With the labor market softening, the case for a Fed cut remains.
June EUR/USD has advanced roughly 3.5% since mid-March, as the dollar weakened on improved risk appetite after the 7 ceasefire.
The ECB held the deposit rate steady at 2.00% at its March 19 meeting, but it increased its 2026 inflation forecast to 2.6% from 1.9% on higher energy prices. Eurozone annual inflation surged to 2.6% in March, up from 1.9% in February.
INTEREST RATES
US Treasury futures experienced significant volatility, as geopolitical events and inflation data whipsawed yields. The 10-year yield was little changed overall, rising from 4.22% to 4.27%, but the intra-period range was substantial, from a high of 4.44% on March 27 to a low of 4.20% on March 17. The 2-year yield increase was more pronounced, rising from 3.68% in mid-March to 3.-8% on April 15, while the 30-year bond yield rose from 4.86% to 4.89%.
The selloff (March 18-27) was driven by the surge in CPI to +3.3% YoY and ISM Price indexes hitting multi-year highs. The energy-driven inflation spike was the primary factor. CPI was +0.9% month-over-month in March, the largest increase since June 2022.
The recovery in bond prices between late March and April 15 coincided with the ceasefire announcement and expectations that oil prices would moderate. If oil falls below $80 per barrel, inflation fears are likely to cool, and that could bring the 10-year yield back toward 4.00-4.10%. However, core CPI inflation at 2.6% YoY suggests that underlying price pressures remain sticky.
March’s nonfarm payrolls report surprised to the upside, with the economy adding 178,000 jobs against expectations of just 59,000. The unemployment rate edged down to 4.3% from 4.4%. Average hourly earnings rose 3.5% YoY. February’s report had shown a loss of 133,000 jobs, so the March rebound was a significant relief. However, the ISM Services employment sub-index fell to 45.2, suggesting underlying labor market softness.
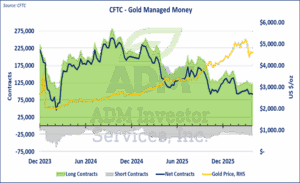
GOLD & SILVER
Gold futures have experienced a severe correction since mid-March, with the nearby contract falling from $5,039 to $4,823, a decline of roughly 4.3%. However, the intra-period range was more volatile. Gold plunged from a $5,082 on March 16 to a low of $4,128 on March 23, a 18.7% drop, before recovering nearly half the move by April 15.
The selloff was initially driven by a surge in the US dollar, then by portfolio rebalancing by institutional investors liquidating gold to meet margin calls and fund equity allocations and by a dramatic repricing of Fed rate cut expectations. With markets pricing no rate cuts for 2026, the opportunity cost of holding non-yielding gold increased sharply.
COPPER
COMEX copper futures (HG) rallied strongly from mid-March to mid-April, advancing from $5.83 to $6.09, a gain of roughly 4.5%. The market experience a sharp selloff in mid-to-late March but then saw a powerful recovery that pushed prices back toward levels last seen in January.
The initial selloff reflected broader risk-off sentiment, global growth concerns from the Iran conflict, and rising LME warehouse stocks. However, copper staged a remarkable recovery that was driven by: 1) the ceasefire boosting demand expectations, 2) expectations that the US Commerce Secretary will recommend a 25%+ tariff on refined copper imports by mid-2026, which sparked pre-emptive buying and COMEX-LME arbitrage, and 3) Goldman Sachs and others continuing to forecast a structural deficit in coming years tied to electrification, AI data center demand, and green infrastructure.
Interested in more futures market commentary? Explore our Market Dashboards here.
Risk Warning: Investments in Equities, Contracts for Difference (CFDs) in any instrument, Futures, Options, Derivatives and Foreign Exchange can fluctuate in value. Investors should therefore be aware that they may not realise the initial amount invested and may incur additional liabilities. These investments may be subject to above average financial risk of loss. Investors should consider their financial circumstances, investment experience and if it is appropriate to invest. If necessary, seek independent financial advice.
ADM Investor Services International Limited, registered in England No. 02547805, is authorised and regulated by the Financial Conduct Authority [FRN 148474] and is a member of the London Stock Exchange. Registered office: 3rd Floor, The Minster Building, 21 Mincing Lane, London EC3R 7AG.
Futures and options trading involve significant risk of loss and may not be suitable for everyone. Therefore, carefully consider whether such trading is suitable for you in light of your financial condition. The information and comments contained herein is provided by ADMIS and in no way should be construed to be information provided by ADM. The author of this report did not have a financial interest in any of the contracts discussed in this report at the time the report was prepared. The information provided is designed to assist in your analysis and evaluation of the futures and options markets. However, any decisions you may make to buy, sell or hold a futures or options position on such research are entirely your own and not in any way deemed to be endorsed by or attributed to ADMIS. Copyright ADM Investor Services, Inc.