Written Commentary

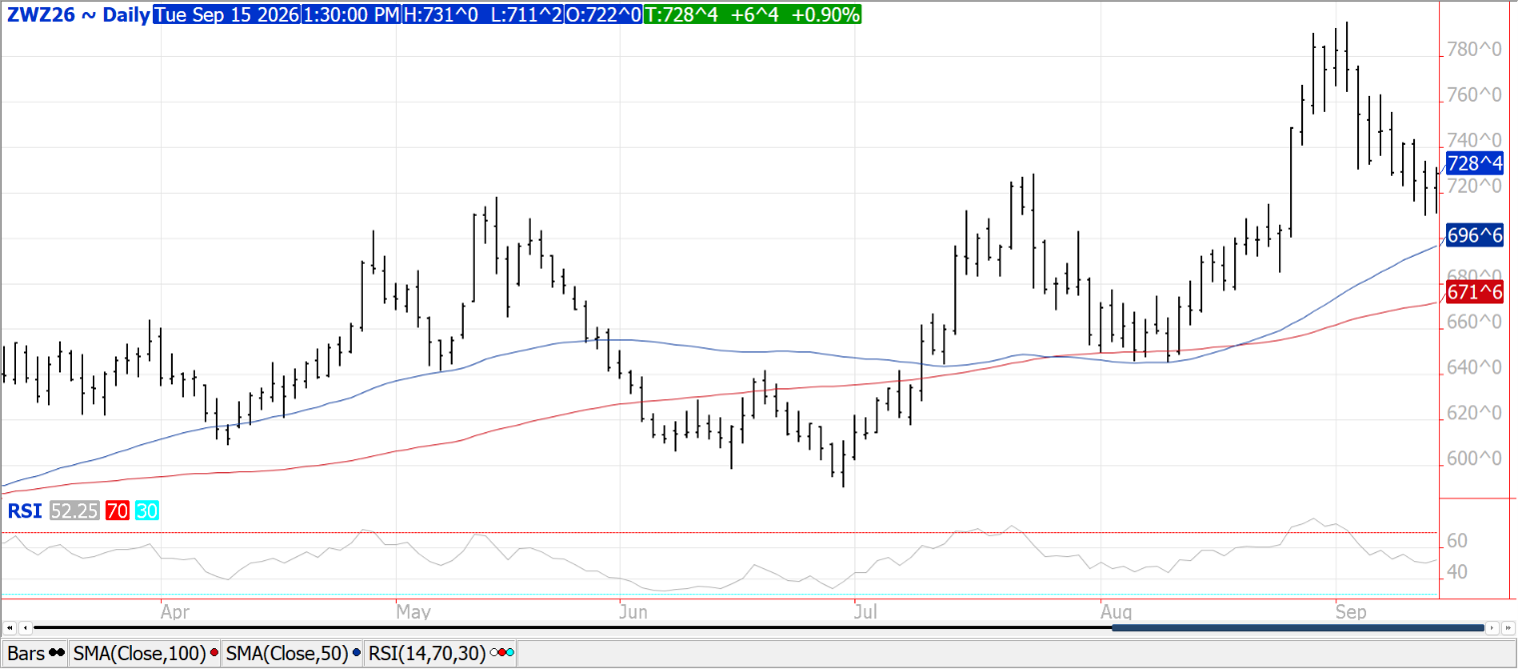
Prices ranged from $.04 to $.12 higher in choppy 2-sided trade. CGO Dec-26 was $.06 ½ higher at $7.28 ½, KC Dec-26 was up $.03 ¾ at $7.96 ¼ while Dec-26 MIAX was $.12 ¼ higher at $7.48 ½. Improved prospects for rain in the C. Plains drove the early price weakness however continued strikes between Ukraine/Russia enable prices to recover. KC and MIAX futures slipped to 3-week lows while inside trade for Dec-26 CGO. Spring harvest advanced to 93% complete, matching the YA pace while below the 5-year Ave. of 92%. Winter wheat plantings at 8% are below the 10% pace from YA and the 5-year Ave. of 12%. Stats Canada out tomorrow is expected to show wheat production at 38.3 mmt, down from 40 mmt YA while just above the USDA est. of 36 mmt. SovEcon is forecasting Russia will export only 1.8 mmt in Sept-26, down from 2 mmt in Aug-26 and well below the 4.6 mmt shipped in Sept-25. EU soft wheat exports as of Sept. 13th at 5.61 mmt are down 2.4% YOY. Algeria reportedly bought around 500k mt of optional origin milling wheat near $320/mt CF. Cash sources suggest Romania and Bulgaria likely the main focus of supplies, however, could include N. Europe, possibly even Russian wheat from the Baltic region. In their last tender in early August Algeria bought 720k mt around $290/mt CF.
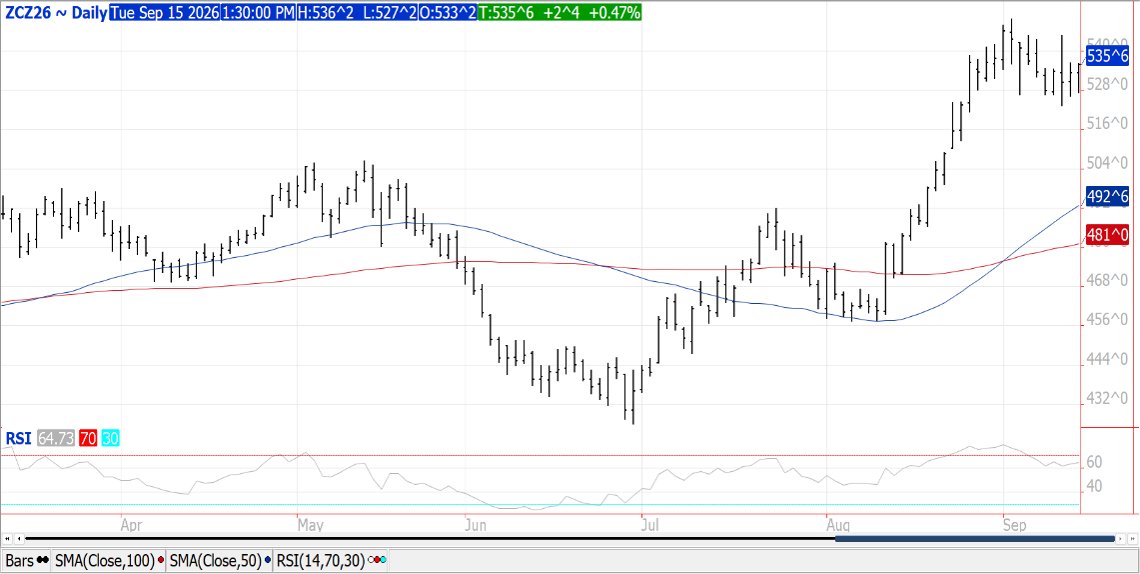
Prices were $.01 to $.02 ½ higher while spreads firmed. Dec-26 futures held within yesterday’s range in 2-sided trade. Crop conditions improved by 1% to 55% G/E. Overall ratings held at the crop cycle lows, just below the historical average. 86% of the crop is dented, 42% mature, both above YA and the 5-year Ave. Harvest has reached 8% vs. 7% YA and 5-year Ave. of 6%. Incorporating updated acres and ratings along with ear population data my model suggests an average US yield of 178.5 bpa with production at 15.797 bil. bu. almost exactly in line with the USDA forecast at 15.80 bil. bu. Conab raised Brazil’s 2025/26 2nd crop production est. 1.1 mmt to 112.1 mmt. Total production is estimated at 144 mmt, above the USDA forecast of 141 mmt. Their 2026/27 first crop plantings have reached 22% vs. 17% YA. France’s farm ministry lowered their 2026 production forecast .9 mmt to 8.1 mmt, well below the 12 mmt from YA and the lowest in over 40 years. 2026/27 EU corn imports as of Sept. 13th at 4 mmt are up 38% YOY. Corn bulls remain hopeful the Trump/Xi meeting this month will result in China’s purchase of US corn.
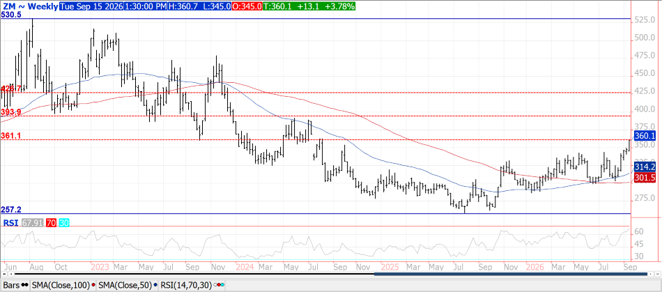
Prices were higher across the complex with beans up $.12-$.15, closing at session highs. Meal jumped $7-$9 while oil recovered late closing 10-20 higher in the nearby contracts. Bean spreads were mixed while product spreads firmed. Crush margins rebounded $.05 ½ to $2.57 bu. while meal PV has jumped to 51%, a 7-month high. Helping fuel the late surge was Conab forecasting Brazil’s 2026/27 soybean acres growing only .7%, the lowest growing in 20 years, to 49.3 mil. HA, with production at 181.6 mmt, below the USDA est. of 186 mmt. US crop conditions were steady at 58% G/E. Harvest has reached 6%, vs. the 5-year Ave. of 3%. Updated ratings, along with USDA acres and pod count data suggest an average US yield of 52.5 bpa with production at 4.512 bil. bu., just below the USDA forecast of 4.535 bil. US Gulf FOB offers holding $.10-$.20 discount to Brazilian offers. NOPA crush in Aug-26 at 205.5 mil. bu. was below 216.65 mil. from July-26 and below expectations of 211.5 mil. It was however a record high for the month, well above the 189.8 mil. bu. from Aug-25. Implied census crush at 211 mil. bu. would bring 25/26 crush total to 2.647 mil. bu., 8 mil. shy of the USDA forecast of 2.655 bil. The daily crush rate fell to the lowest in 12 months at 6.81 mbd. Oil stocks slipped to 1.201 bil. lbs. down 11.7% from July and the lowest since Nov-24. Stocks were also below the Ave. est. of 1.257 bil. lbs. while within the range of estimates.
Risk Warning: Investments in Equities, Contracts for Difference (CFDs) in any instrument, Futures, Options, Derivatives and Foreign Exchange can fluctuate in value. Investors should therefore be aware that they may not realise the initial amount invested and may incur additional liabilities. These investments may be subject to above average financial risk of loss. Investors should consider their financial circumstances, investment experience and if it is appropriate to invest. If necessary, seek independent financial advice.
ADM Investor Services International Limited, registered in England No. 02547805, is authorised and regulated by the Financial Conduct Authority [FRN 148474] and is a member of the London Stock Exchange. Registered office: 3rd Floor, The Minster Building, 21 Mincing Lane, London EC3R 7AG.
A subsidiary of Archer Daniels Midland Company.
© 2026 ADM Investor Services International Limited.
Futures and options trading involve significant risk of loss and may not be suitable for everyone. Therefore, carefully consider whether such trading is suitable for you in light of your financial condition. The information and comments contained herein is provided by ADMIS and in no way should be construed to be information provided by ADM. The author of this report did not have a financial interest in any of the contracts discussed in this report at the time the report was prepared. The information provided is designed to assist in your analysis and evaluation of the futures and options markets. However, any decisions you may make to buy, sell or hold a futures or options position on such research are entirely your own and not in any way deemed to be endorsed by or attributed to ADMIS. Copyright ADM Investor Services, Inc.