Written Commentary

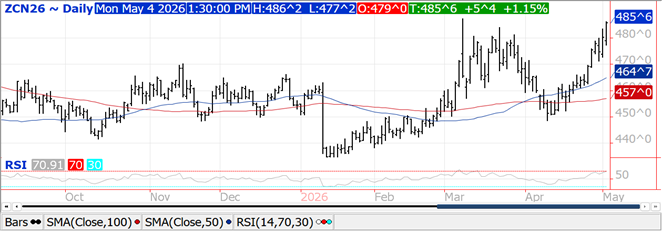
Prices were $.05-$.06 higher while spreads were little changed. July-26 jumped out to a fresh 2-month high with next resistance at the March high of $4.87 ½. Dec-26 traded to a fresh 2 ½ year high with next resistance at its contract high at $5.12 ½. MM’s bought nearly 80k contracts of corn, pushing their long position to 264k contracts. Index funds bought 33,495 contracts, stretching their long position to just over 400k for the 1st time in 14 months. Corn used for ethanol in Mch-26 at 474 mil. bu. was up 10% from Feb-26 and up 4.8% YOY. In the first 7 months of the 25/26 MY usage has reached 3.225 bil. up .6% from YA vs. USDA forecast of up 3%. To reach the USDA forecast, April through Aug-26 usage will need to reach 475 mil. bu. per month, up 6.2% from YA. Export inspections at 80 mil. bu. were above expectations. YTD inspections at 2.184 bil. are up 31% from YA vs. the USDA forecast of up 16%. Noted buyers were Mexico – 17 mil. while Japan, S. Korea, Colombia and Taiwan all bought between 8 – 12 mil. bu.
Prices were higher across the complex with beans up $.14-$.20, meal was $2-$3 higher while oil was up a full $.01+ per lb. Bean and oil spreads firmed while meal spreads were weaker. July-26 beans jumped out to a 2-month high with next resistance at its March high at $12.50 ¾. Nov-26 traded above $12 with next resistance at its contract high at $12.41. New contracts high for July-26 oil. Higher energy prices and improved demand for biofuels were the principal reason for higher bean oil prices. Energy prices were moderately higher as tensions in the Persian Gulf remain elevated. Earlier today the UAE missile alert system intercepted several missiles fired from Iran. Spot board crush margins pulled back another $.05 today to $3.56 bu. while bean oil PV reached a new all-time high at 54.9%. Mch-26 crush at just over 227 mil. bu. was below expectations of 231 mil. Cumulative crush over the 1st 7 months of the MY at 1.561 bil. bu. is up 8.5% from YA, vs. the USDA forecast of up 6.8%. The daily crush rate at 7.34 mbd was a 6-month low. Bean oil stocks slipped to 2.456 bil. roughly 100 mil. below expectations. Under current market dynamics, RD production using bean oil as a feedstock is still profitable with prices well over $.80 lbs. MM’s bought only 281 contracts of soybean oil but it extended their record long position to nearly 166k. Export inspections at 17 mil. bu. were at the low end of expectations. YTD inspections at 1.222 bil. are down 23% from YA vs. the USDA forecast of down 18%. China took just over 7 mil. bu. In advance of the Trump/Xi summit in Beijing in just over a week, Treasury Sec. Bessent urged China to persuade Iran to open up the Strait of Hormuz.
Prices were mixed ranging from $.05 lower in MIAX to $.03 higher in CGO. CGO July-26 was $.03 ¼ higher at $6.41, KC July-26 was steady at $6.94 ½, while MIAX July-26 was down $.05 at $6.99. Across the 3 classes of wheat MM’s bought 30,643 contracts extending their combined long position to nearly 69k contracts, the largest since June-22. Spring wheat plantings likely reached 30%, vs. 42% YA and 5-year Ave. of 35%. For the 1st time in 4 years India’s Govt. has lifted wheat export restrictions given the higher international prices while domestic supplies are ample. While a 22k mt vessel priced at $275/mt FOB destined for the UAE has already been loaded they aren’t likely to see sales reach this 5 mmt level. Export inspections at 16 mil. bu. were in line with expectations. YTD inspections at 819 mil. bu. are up 12% from YA, vs. the USDA forecast up 9%.
Risk Warning: Investments in Equities, Contracts for Difference (CFDs) in any instrument, Futures, Options, Derivatives and Foreign Exchange can fluctuate in value. Investors should therefore be aware that they may not realise the initial amount invested and may incur additional liabilities. These investments may be subject to above average financial risk of loss. Investors should consider their financial circumstances, investment experience and if it is appropriate to invest. If necessary, seek independent financial advice.
ADM Investor Services International Limited, registered in England No. 02547805, is authorised and regulated by the Financial Conduct Authority [FRN 148474] and is a member of the London Stock Exchange. Registered office: 3rd Floor, The Minster Building, 21 Mincing Lane, London EC3R 7AG.
A subsidiary of Archer Daniels Midland Company.
© 2026 ADM Investor Services International Limited.
Futures and options trading involve significant risk of loss and may not be suitable for everyone. Therefore, carefully consider whether such trading is suitable for you in light of your financial condition. The information and comments contained herein is provided by ADMIS and in no way should be construed to be information provided by ADM. The author of this report did not have a financial interest in any of the contracts discussed in this report at the time the report was prepared. The information provided is designed to assist in your analysis and evaluation of the futures and options markets. However, any decisions you may make to buy, sell or hold a futures or options position on such research are entirely your own and not in any way deemed to be endorsed by or attributed to ADMIS. Copyright ADM Investor Services, Inc.