Written Commentary

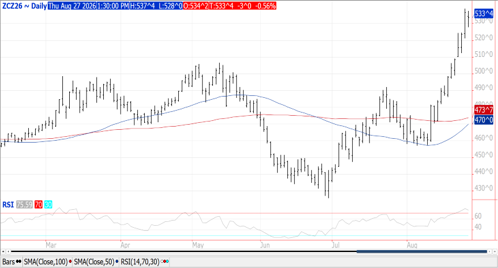
Prices slumped late closing $.03-$.06 lower in choppy 2-sided trade while spreads were mixed. Sept-26 and Dec-26 both held within yesterday’s range. Coming into today we had the speculative long position nearing 400k contracts for the first time since April-21, vs. the record long position of 429k from back in Oct-2010. Open interest on yesterday’s price surge however was down 5.6k contracts. Speculative traders were moderate sellers today. Argus is forecasting French corn production at only 6.9 mmt, down 48% YOY and the lowest production in 50 years. Expectations for lower US production and the potential for higher demand resulting in significantly lower US and global stocks has fueled the recent price surge. Exports at 43 mil. bu. were in line with expectations. Old crop sales have reached 3.455 bil. bu. up 25% YOY vs. the USDA forecast of up 18%. Pace analysis suggests the USDA 25/26 export forecast at 3.400 is still 25-50 mil. bu. too low. New crop commitments have reached 490 mil. bu. falling behind the YA by 34%. Noted buyers were unknown – 17 mil. while Mexico purchased 8 mil.
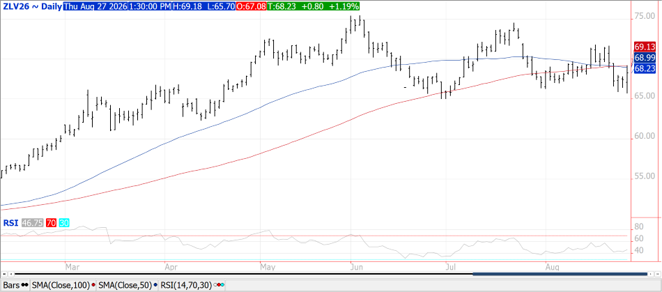
Prices were higher across the complex in volatile, 2-sided trade. Beans were $.01-$.02 higher, meal was up $1-$2 while bean oil rebounded 70-80 points. Both Sept-26 and Nov-26 beans scratched out new contract highs. Oct-26 meal traded to a 9-month high. Oct-26 oil held support above its June low of $.65 lb., recovering to challenge its 100-day MA resistance at 69.13. Wire services reported the Trump Admin. discussed plans to compensate biofuel manufacturers harmed by higher SRE. Crush margins rebounded $.09 ½ to $2.18 bu. after falling to a 6-month low yesterday. The Trump Admin. excluded China from Iranian sanctions allowing them time to shift energy demand to other suppliers. China’s US soybean purchases are stacking up ahead of Xi visit to Washington DC next month. Bean sales at 94 mil. were at the high end of expectations. Old crop commitments at 1.541 bil. bu. are down 17% from YA vs. the USDA forecast of down 20%. China’s new crop purchases have reached 6.8 mmt (248 mil. bu.). There is another 4.87 mmt (178 mil. bu.) to unknown. Additional flash sales take China purchased to nearly 8 mmt with 5.7 mmt to unknown. New crop commitments jumped to 527 mil. bu., a 4-year high, up 98% YOY. Meal sales at 428k tons were at the high end of expectations. Old crop commitments are up 15% YOY vs. the USDA forecast of up 13.4%. Uncertain US production combined with Chinese buying provide little wiggle room for the US crop to slip below the current USDA forecast of 4.519 bil. bu.
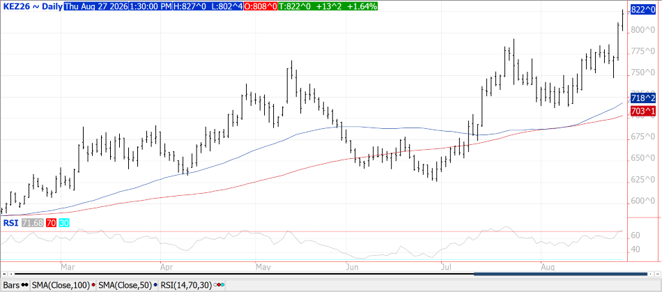
Prices ranged from $.09-$.13 higher in choppy 2-sided trade with new contract highs in both CGO and KC. CGO Dec-26 was up $.12 ½ at $7.60 ¾, KC Dec-26 was $.13 ¼ higher at $8.22 while Dec-26 MIAX is up $.09 ¾ at $7.57 ¾. Ukraine’s grain shipments in August have reached only 574k mt, down 60% YOY. Growing drought conditions in S. Ukraine threaten to delay or reduce winter wheat plantings for the 2027 harvest. Logistical issues may be starting to turn into supply issues. Egypt, the world’s largest wheat importer who typically imports 80% of their wheat from Russia/Ukraine has reportedly bought 2 cargoes of wheat from France. Sudan has also reportedly bought a cargo of wheat from France, their first in 18 years. Argus reports France’s soft wheat production will reach 30.8 mmt, down 7.6% YOY while all EU production at 161.5 mmt is down 9%. US wheat sales at 15 mil. bu. were in line with expectations. YTD commitments at 304 mil. are down 32% from YA vs. the USDA forecast of down 15%. Tunisia reportedly bought 125k mt of soft wheat at $305/mt CF for Sept-Nov shipment while passed on making any purchase in their 120k mt tender.
Risk Warning: Investments in Equities, Contracts for Difference (CFDs) in any instrument, Futures, Options, Derivatives and Foreign Exchange can fluctuate in value. Investors should therefore be aware that they may not realise the initial amount invested and may incur additional liabilities. These investments may be subject to above average financial risk of loss. Investors should consider their financial circumstances, investment experience and if it is appropriate to invest. If necessary, seek independent financial advice.
ADM Investor Services International Limited, registered in England No. 02547805, is authorised and regulated by the Financial Conduct Authority [FRN 148474] and is a member of the London Stock Exchange. Registered office: 3rd Floor, The Minster Building, 21 Mincing Lane, London EC3R 7AG.
A subsidiary of Archer Daniels Midland Company.
© 2026 ADM Investor Services International Limited.
Futures and options trading involve significant risk of loss and may not be suitable for everyone. Therefore, carefully consider whether such trading is suitable for you in light of your financial condition. The information and comments contained herein is provided by ADMIS and in no way should be construed to be information provided by ADM. The author of this report did not have a financial interest in any of the contracts discussed in this report at the time the report was prepared. The information provided is designed to assist in your analysis and evaluation of the futures and options markets. However, any decisions you may make to buy, sell or hold a futures or options position on such research are entirely your own and not in any way deemed to be endorsed by or attributed to ADMIS. Copyright ADM Investor Services, Inc.