Commodities Overview | August 2026 Edition

MONTHLY COMMODITIES MARKET OVERVIEW

>>Read the complete, in-depth August 2026 Edition HERE
KEY HIGHLIGHTS

CORN

  • In the August WASDE report, USDA cut US 2025/26 corn ending stocks by 75 million bushels to 1.945 billion, 55 million below expectations.
  • Exports rose 75 million bushels to a record 3.4 billion.
  • 2026 US production was up 13 million bushels to 16.013 billion, 80 million above expectations.
  • Harvested acres were up 1.16 million to 88.592 million, while yields were cut 2.3 bushels per acre to 180.7, still the second highest ever.
  • New crop exports up 75 million bushels to 3.275 billion.

SOYBEANS

  • August WASDE showed US 2025/26 soybean ending stocks cut 5 million bushels to 325 million on higher crush, in line with expectations.
  • Meal exports raised 200,000 tons for 2025/26 and 700,000 for 2026/27.
  • Bean oil exports were cut 225 million pounds for 2025/26; usage for biofuel production raised 150 million pounds, while other domestic usage up 60 million.
  • 2026 US soybean production raised 44 million bushels to 4.519 billion, 50 million above expectations.

WHEAT

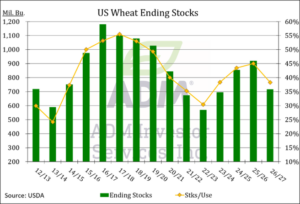
  • August WASDE showed US 2026 all wheat production lowered by 5 million bushels to 1.531 billion, the lowest since 1970.
  • Winter wheat production unchanged at 990 million bushels, 10 million above expectations.
  • WW harvested acres were down 170,000 to 21.04 million, with average yield up 0.3 bushels per acre to 47.
  • HRW production down 8 million bushels to 463; SRW unchanged at 287 million, white up 8 million to 240 million.

Wheat Chart on 8.24.2

COCOA

• As of August 16, cumulative cocoa arrivals at Ivory Coast ports had reached 1.996 million tons, up from 1.653 million at that time last year and the highest            since 2022/23. The five-year average is 1.963 million.
• Ivory Coast exporters association GEPEX reported the nation’s cumulative cocoa grind through July reached 553,731 tons, up 7.5% from last year. Ivory                Coast has total grinding capacity of 750,000 tons and vies with the Netherlands as world’s largest.
• Ghana’s cocoa regulator, COCOBOD, reported 750,000 tons were harvested in 2025/26, up 25.6% from the previous season.
COFFEE

  • The Brazilian harvest was delayed by extreme rainfall events that hit the key arabica growing region in June. The rains also reportedly caused beans to drop to the ground. Drier conditions have emerged since to help harvest recover, but it is still running behind, and there is some uncertainty as to the possible damage. Some quality loss is expected.
  • Safras & Mercado reported that Brazil had completed 90% of its 2026/27 harvest as of August 12, down from 97% at this point last year. The robusta harvest was nearly done, and the arabica harvest had reach 86% of expected production versus 95% at this point last year.
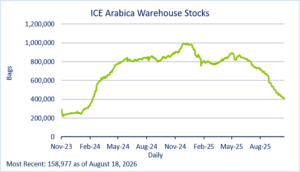
  • Near term supplies remain tight. As of August 18, ICE certified arabica stocks totaled 229,214 bags, their lowest since December 4, 2023.
  • The 7.4-magnitude earthquake that hit Colombia in early August interrupted activity at their largest coffee port of Buenaventura


Coffee Chart on 8.24.26


COTTON

  • In the August WASDE Report, USDA lowered its forecast for US 2026/27 cotton production to 13.61 million bales from 13.70 million in the July update.
  • Average yield was lowered to 798 pounds per acre versus 872 in July, but planted area was raised 6% from the previous month and harvested area by 8%.
  • Exports were left unchanged at 12.30 million bales, and ending stocks were lowered to 4.00 million bales from 4.10 million in July.
  • This put the stocks/use ratio at 28.8% versus 29.5% in July, 30.5% last year, and a five-year average of 28.6%.

SUGAR

  • There are still expectations for a global supply deficit in 2026/27 season due to El Nino bringing dry conditions to beet areas of Europe as well as key cane-growing regions of India and Thailand.
  • Southern and some areas of west-central Thailand have seen lighter and more sporadic rainfall than usual, and that we expected to continue into the end of August.
  • India has already seen a rain deficit this year, and record sugar prices have prompted the government to limit exports, discourage ethanol production and even allowing limited duty-free imports. News that the Indian government will allow duty-free imports of 1 million metric tons in the next few 31 was sparked a rally in  nearby sugar to its highest level since May 2025.
  • Brazil’s Agriculture Ministry put Center-South sugar production at 3 million metric tons for the second half of July, which was down 17% from the same period last year. Cane crushing was -8.4% from year ago, while ethanol production (cane and corn combined) was +2.8%.

CRUDE OIL

  • As of this writing, negotiations towards reopening the Strait of Hormuz appeared dead in the water, with Iran having a list of demands for reopening and the US blockading the strait in an attempt instill more economic pain on the country
  • Current flows through the strait are minimal, with an average of roughly 11 commodity ships moving through according to data from Kpler versus 130-140 prior to the war. These latest numbers include very few if any very large crude carriers or LNG tankers.
  • Gulf producers have been adjusting to the new circumstances by looking to expand pipelines to the Red Sea and Mediterranean ports and to the other side of the Strait of Hormuz. They are also looking at expanding storage facilities outside the region. This has helped mitigate some of the supply interruptions, though Houthi attacks on shipping through the Bab el-Mandeb strait at the southern end of the Red Sea is causing problems as well.


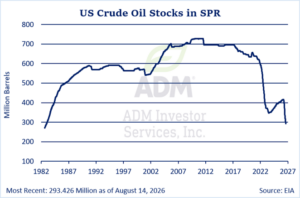
Crude Oil Chart on 8.24.26


NATURAL GAS

  • US output remains strong, with LSEG lower 48 states production at 111.6 billion cubic feet per day (bcfd) as of mid-August, up from a record 110.7 bcfd in July.
  • For most of the summer, above normal temperatures have predominated the US lower 48 states, but that has done little to pull supplies in the face of record output.
  • As of August 14, US gas in storage was 0.9% below a year but 6.4% above the five-year average.

LIVE CATTLE

  • As of August 15, year to date US federal cattle slaughter was 1,470,433 head, down 5.5% from a year ago.
  • Year to date US beef production was down 5.5%.
  • But even with the lower slaughter, cattle prices had declined since June 22.
  • The highest closing price for the August Live Cattle futures was on June 16 at $249.20. Prices tumbled to $223.00 by July 23, and after a quick bounce in July, they fell to $220.35 by August 14.
  • Beef imports were an important factor in the price decline. As of August 8, imported beef passed for inspection was up 12% on the year at 1,181,864 metric tons.

LEAN HOGS

  • On of August 15, cumulative US hog slaughter for 2026 was down 511,919 from the same period in 2025. This was the second year hog slaughter has dropped. (The same period in 2025 saw a 1,889,309 decline from 2024.) However, 2026 hog weights are up from 2025, putting pork production up 4% for the year.
  • The August 2026 Lean Hog futures went off the board at $95.40 versus $109.65 for the expiration of the August contract the previous year.
  • Hog and pork prices are lower because global production is up.
  • China, with about half of the world’s hog production, increased slaughter by 2.8% the first quarter. The nation is culling sows to bring down production.

STOCK INDEX FUTURES

  • Stock index futures have put in a strong, broad-based market performance over the past month with historically low volatility, despite the geopolitical backdrop. From July 15 to August 17, the September S&P rose 2%, the September Dow was up 1.6%, and the September Nasdaq gained 0.5%.
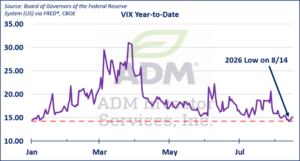
  • Pressure on the tech sector, particularly in semiconductors and AI-related names, has eased relative to previous months, though risks remain. The VIX is reflecting one of the calmest periods of 2026, having closed at a 2026 low on August 14. Since President Trump began his second term in January 2025, the VIX has closed lower a total of six times.
  • Bloomberg’s “other 493,” which excludes the Magnificent Seven, the equal-weighted S&P 500, and the S&P 500 ex-tech have all risen strongly, as corporate earnings per share and revenue have outperformed, suggesting growth outside of the AI narrative. Still, geopolitical risk remains in play, as the US-Iran memorandum of understanding has expired without any material agreement or prospect of agreement in place.


VIX Chart on 8.24.26


CURRENCIES

  • The US Dollar Index fell sharply between July 15 and August 19, thanks to a pullback in Fed tightening expectations and the recent Treasury Department’s plan to double the size of its buybacks of long-term debt.
  • A round of soft data for July has been reduced tightening expectations, though renewed safe-haven flows resulting from the US-Iran war are beginning to limit further downside. The Dollar Index fell below the 100 level at the end of July has and repeatedly failed to reclaim it.
  • Despite the July’s CPI alleviating some fears of broad-based inflation, core inflation still rests above the Fed’s 2% target, and money markets have priced-in one rate hike by December.
  • The euro gained roughly 1% against the dollar between July 15 and August 17, as a reduction in expectations for Fed tightening and shored-up bets of European Central Bank tightening were favorable to the currency

INTEREST RATES

  • Treasury yields no longer appear to be at the mercy of Fed rate hike expectations and oil prices. Increases in corporate supply, strong equity performance, and government debt appear to explain the rise in yields, while inflation expectations have remained anchored.
  • The Treasury Department’s announcement that it would double the size of its buyback operations for longer-dated debt (10 to 30-year horizon) was supportive of prices at the end of the curve, but it also underscored the rising concerns over US public debt and rising supply.
  • The vast amounts of debt being issued to fund AI capital expenditures means Treasuries have to compete with corporate debt, and that alongside a growing budget deficit is likely to continue put upward pressure on yields.

GOLD 

  • Gold prices have reversed their downward trend, with December COMEX contracts marking a 12% gain from July 15 to August 19. Near-term Fed tightening expectations have waned, and real yields have risen modestly. The dollar has lost substantial strength as well, making foreign purchases more enticing.
  • The challenges that gold has faced in recent months are still present, but with fewer obstacles. With core CPI at 2.5%, headline inflation is well over the Fed’s 2% target, but the market has reduced expectations for Fed tightening, having viewed the July CPI report as benign.
  • The Treasury’s buyback announcement proved strongly supportive to gold, with December contracts rallying 3% on the news.
  • Gold is still trading as a pure macro asset, with a relatively tight inverse relationship to the dollar and US 2-Year yields.

Gold Chart on 8.24.26


COPPER

  • COMEX copper futures rose more than 3% between July 15 and August 19, and cash LME prices touched record highs in mid-August, as worries over lower LME inventory, accelerated shipments to the US amid expectations of US tariffs, and broad-based demand for AI infrastructure and energy transition underpinned demand.
  • Supply worries continue in the global market as warehouse inventory is shipped to the US, and this is helping to keep the LME cash copper contract trading at a premium to the three-month benchmark. However, it has declined at the start the second half of August as some copper has flowed back into the LME system. The premium was trading near $170 as of August 19, down from $270 on August 18 and $545 on August 17.


Interested in more futures market commentary?  Explore our Market Dashboards here.

Risk Warning: Investments in Equities, Contracts for Difference (CFDs) in any instrument, Futures, Options, Derivatives and Foreign Exchange can fluctuate in value. Investors should therefore be aware that they may not realise the initial amount invested and may incur additional liabilities. These investments may be subject to above average financial risk of loss. Investors should consider their financial circumstances, investment experience and if it is appropriate to invest. If necessary, seek independent financial advice.

ADM Investor Services International Limited, registered in England No. 02547805, is authorised and regulated by the Financial Conduct Authority [FRN 148474] and is a member of the London Stock Exchange. Registered office: 3rd Floor, The Minster Building, 21 Mincing Lane, London EC3R 7AG.                  

A subsidiary of Archer Daniels Midland Company.

© 2026 ADM Investor Services International Limited.

Futures and options trading involve significant risk of loss and may not be suitable for everyone.  Therefore, carefully consider whether such trading is suitable for you in light of your financial condition.  The information and comments contained herein is provided by ADMIS and in no way should be construed to be information provided by ADM.  The author of this report did not have a financial interest in any of the contracts discussed in this report at the time the report was prepared.  The information provided is designed to assist in your analysis and evaluation of the futures and options markets.  However, any decisions you may make to buy, sell or hold a futures or options position on such research are entirely your own and not in any way deemed to be endorsed by or attributed to ADMIS. Copyright ADM Investor Services, Inc.

Latest News & Market Commentary

Explore the latest edition of The Ghost in the Machine

Explore Now