Written Commentary

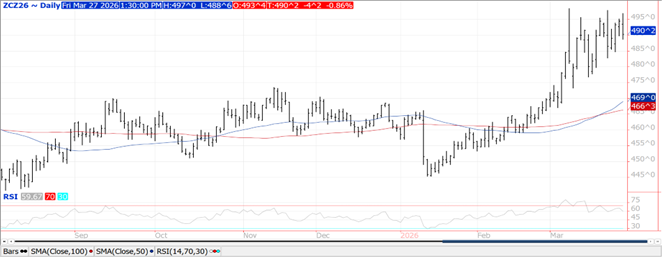
Prices were $.04-$.05 lower as spreads weakened. Dec-26 stalled just below its March high of $4.98 ½ setting up today’s pullback. No surprise with EPA keeping US ethanol blend mandate at 15 bil. gallons. The Reuters poll shows analysts expected Mch. 1st stocks at 9.104 bil. bu. up from 8.147 YA. Estimates range from 8.575 – 9.378 bil. Corn acres are expected to slip to 94.371 bil. down from 98.788 YA. We are at 93.75 mil. with the range of guesses 92.60 – 96 mil. US exports remain strong with YTD commitments at 2.712 bil. bu. up 30% from YA, vs. the USDA forecast of up 15.5%. The quarterly hog/pig report showed Mch. 1st inventories at 100% of YA levels, just below expectations of 101%. The end of March USDA reports have been supportive for corn in recent years closing higher the past 5, and 65% of the years since 2000. Dry conditions in the south should have enabled sizable corn plantings this week in TX, LA, MS and AR.
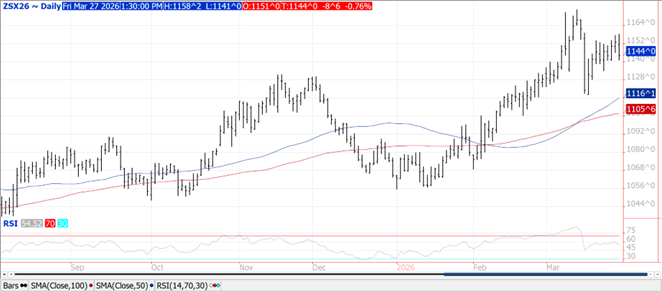
Prices finished lower across the complex with beans off $.08-$.15, meal fell $4-$6 while oil was down 20-60 points. Nov-26 beans did stretch out to new highs for the week before backing up. Support for May-26 meal is at its 100 day MA at $314. Agricultural prices for today at least seperated themselves from higher energy trade. Energy markets surged after a lower start overnight shrugging off Pres. Trump’s decision to extend a deadline to attack Iran’s energy infrastructure. In his social media post the Pres. maintains the extension was at the request of the Iranian Govt. and that peace negotiations are ongoing while Iran claims they have no intentions of holding direct talks with the US. The Biomass-based diesel volume figure at 9.07 bil. gallons (which includes 70% SRE reallocation) was in line with expectations. In 2025 the actual biodiesel and RD production volume averaged roughly 61% of the R4 RIN’s generated on a monthly basis, implying an actual green diesel production of 5.4-5.5 bil. gallons annually, vs. expectations of 5.3-5.6 bil. Foreign feedstocks will be eligible for a full RIN credit up to 2028 when it falls to 50%. This was viewed as a disappointment. Next week’s EIA data for biodiesel and RD production for Jan-26 along with the feedstock usage data will shift attention back to how slow demand of bean oil for the production of biofuels has been in the 25/26 MY given the policy uncertainties. The USDA did announce the sale of 105k mt (4 mil. bu.) of soybeans to an unknown buyer. Pres. Trumps trip to Beijing being rescheduled for mid-May fueled speculative buying this week. The Reuters poll shows analysts expected Mch. 1st stocks at 2.067 bil. bu. up from 1.911 YA. Estimates range from 1.880 – 2.125 bil. We are near the high end of the range at 2.116 bil. Bean acres are expected to jump to 85.55 bil. up from 81.215 YA.
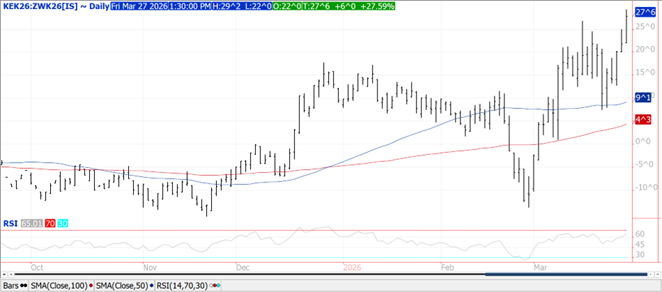
Prices range from steady in CGO to $.06 higher in KC. All 3 classes pushed into new highs for the week. US winter wheat area in drought expanded 2% this past week to 57%, a new 52 week high. It appears HRW wheat is seeing an expansion of acres in drought, due to hot/dry in the plains, while SRW is seeing drought stress ease. Look for further expansion in drought readings next week. Eventually rains in the extended forecast will need to find a rain gauge in order for HRW crop prospects to improve. The Reuters poll shows analysts expected Mch. 1st stocks at 1.310 bil. bu. up from 1.237 YA. We are at 1.323 bil. with the range of est. at 1.289 – 1.334 bil. All wheat acres are expected to slip to 44.786 down from 45.328 YA. Winter wheat acres are expected to fall to 32.73 mil. vs. 33.153 YA. For WW we are at 32.6 mil. with a range of est. 31.9 to 33.4 mil. Algeria is believed to have purchased 660-700k mt of wheat near $272/mt CF likely sourced from the Black Sea region.
Charts provided by CQG
Risk Warning: Investments in Equities, Contracts for Difference (CFDs) in any instrument, Futures, Options, Derivatives and Foreign Exchange can fluctuate in value. Investors should therefore be aware that they may not realise the initial amount invested and may incur additional liabilities. These investments may be subject to above average financial risk of loss. Investors should consider their financial circumstances, investment experience and if it is appropriate to invest. If necessary, seek independent financial advice.
ADM Investor Services International Limited, registered in England No. 02547805, is authorised and regulated by the Financial Conduct Authority [FRN 148474] and is a member of the London Stock Exchange. Registered office: 3rd Floor, The Minster Building, 21 Mincing Lane, London EC3R 7AG.
A subsidiary of Archer Daniels Midland Company.
© 2026 ADM Investor Services International Limited.
Futures and options trading involve significant risk of loss and may not be suitable for everyone. Therefore, carefully consider whether such trading is suitable for you in light of your financial condition. The information and comments contained herein is provided by ADMIS and in no way should be construed to be information provided by ADM. The author of this report did not have a financial interest in any of the contracts discussed in this report at the time the report was prepared. The information provided is designed to assist in your analysis and evaluation of the futures and options markets. However, any decisions you may make to buy, sell or hold a futures or options position on such research are entirely your own and not in any way deemed to be endorsed by or attributed to ADMIS. Copyright ADM Investor Services, Inc.