Written Commentary

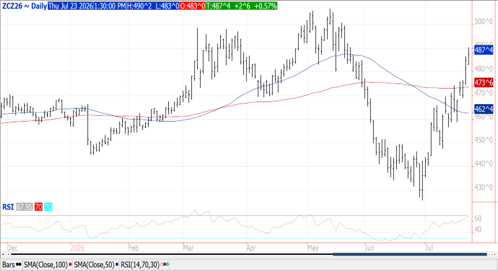
Prices were $.02-$.03 higher in choppy 2-sided trade. Spreads were mixed and little changed. Both Sept-26 and Dec-26 jumped out to fresh 8-week highs. Exports at 41 mil. bu. was in line with expectations. Old crop commitments at 3.410 bil. bu. is up 24% from YA vs. the USDA forecast of up 16%. Commitments represent nearly 103% of the USDA forecast, above the historical average of 96%. Looking ahead to the Aug-26 WASDE I look for another 25-50 mil. bu. shift in usage for ethanol production to exports. New crop commitments have reached 298 mil. bu. a 5-year high while up 12.5% from YA. Tomorrow’s cattle on feed report is expected to show inventories at 102.2% of YA at 11.372 mil. head. Threatening US weather combined with hopes of Chinese demand keep the path of least resistance higher. Huge speculative buying yesterday took the MM long position back up to roughly 100k contracts. O.I. rose nearly 7k. This year’s high so far for Dec-26 corn is $5.06 ½ which occurred in May. Since 1980 December corn peaked in the month of May only 5 times, 11%. I look for new highs, likely peaking in July or August. Fun Fact: the average high in December corn after Q1 (April thru Dec) is 25% above its 1st Qtr. low. With this year’s Q1 low at $4.45 ¼, just an average growing season rally would extend Dec-26 corn to $5.56.
Prices were mixed across the complex with beans $.03-$.05 higher, meal was down $1 while oil was 10-20 higher in volatile trade. New contract high for Nov-26 beans while Aug-26 reached its highest level in 2 ½ years. Next resistance for old crop is $12.58 ¼, the May-24 high on the weekly continuation chart. Aug-26 meal stalled at yesterday’s high setting up the price pullback. Aug-26 oil jumped out to a 7-week high. Crush margins were down $.06 ½ to $3.20 bu. with bean oil PV improving to 53.4%. Bean exports at 59 mil. was in line with expectations. Old crop commitments are down 19% from YA vs. the USDA forecast of down 20%. Old crop shipments to China have reached 12.3 mmt while new crop purchases of 1 mmt took YTD commitments to 2.26 mmt (82 mil. bu.). There are another 2.46 mmt (90 mil.) to unknown. Total new crop commitments at 225 mil. bu. are a 4-year high while up 135% YOY. Meal sales at 591k tons were above expectations. Old crop commitments are up 15% YOY vs. the USDA forecast of up 12%. Oil commitments are down 65% from YA vs. USDA forecast down 60%. Continued demand interest from China coupled with an uncertain weather outlook in the WCB will likely keep the path of least resistance to the upside. The combined speculative long position in the soybean complex is approaching 300k, still well below the May-26 record at just over 501k. Today’s high in Nov-26 beans at $12.49 ½ is 18.4% above its Q1 low. Like Dec-26 corn, the average growing season high is 25% above the Q1 low. With this year’s Q1 low at $10.55 ½, just an average growing season rally would extend Nov-26 beans to $13.20. Since 1980 November beans have peaked in July 7 times, or 15% of the years considered.
Prices ranged from steady to $.10 lower. CGO Sept-26 was down $.09 ½ at $6.96 ¼ after trading to a new contract high. KC Sept-26 was $.03 ¾ lower at $7.59 ¾ while holding within yesterday’s range. MIAX Sept was up $.01 at $7.30, also holding within yesterday’s range. Hopes for a quick solution to the supply disruptions from the Black Sea region are fading. Yesterday was Day 2 of the ND Wheat Quality Council’s crop tour. They estimated yields in the NW portion of the state at 48 bpa, up from the 47.1 yield YA. The tour ends today with a final yield and production forecast expected this afternoon. The USDA is forecasting an average yield of 58 bpa, just below the 2024 record yield of 59 bpa. Exports at 11 mil. bu. were at the low end of expectations. YTD commitments are down 26% from YA, vs. the USDA forecast of down 15%. Spring wheat acres in drought rose 1% to 25%, WW acres in drought slipped 1% to 47% while durum acres in drought plunged 18% to 22%.
Risk Warning: Investments in Equities, Contracts for Difference (CFDs) in any instrument, Futures, Options, Derivatives and Foreign Exchange can fluctuate in value. Investors should therefore be aware that they may not realise the initial amount invested and may incur additional liabilities. These investments may be subject to above average financial risk of loss. Investors should consider their financial circumstances, investment experience and if it is appropriate to invest. If necessary, seek independent financial advice.
ADM Investor Services International Limited, registered in England No. 02547805, is authorised and regulated by the Financial Conduct Authority [FRN 148474] and is a member of the London Stock Exchange. Registered office: 3rd Floor, The Minster Building, 21 Mincing Lane, London EC3R 7AG.
A subsidiary of Archer Daniels Midland Company.
© 2026 ADM Investor Services International Limited.
Futures and options trading involve significant risk of loss and may not be suitable for everyone. Therefore, carefully consider whether such trading is suitable for you in light of your financial condition. The information and comments contained herein is provided by ADMIS and in no way should be construed to be information provided by ADM. The author of this report did not have a financial interest in any of the contracts discussed in this report at the time the report was prepared. The information provided is designed to assist in your analysis and evaluation of the futures and options markets. However, any decisions you may make to buy, sell or hold a futures or options position on such research are entirely your own and not in any way deemed to be endorsed by or attributed to ADMIS. Copyright ADM Investor Services, Inc.