Written Commentary

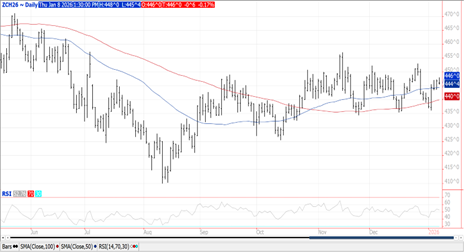
Prices finished mixed and within a penny of unchanged. Spreads weakened. Mch-26 traded to its highest level in nearly 2 weeks before pulling back in late trade. Price remain well within its nearly 3 month range of $4.35-$4.55. The Reuters poll shows analysts expect US corn production to fall 200 mil. bu. to 16.552 bil. with the Ave. yield slipping to 184 bpa. Much of the lower production will likely be offset by lower feed usage. Dec. 1st stocks expected to come in a record high of 12.962 bil. well above the 12.075 bil. YA, however below my forecast of 13.180 bil. Weekly exports at 15 mil. bu. were a MY low and well below expectations. YTD commitments at 2.004 bil. bu. up 30% from YA, vs. the USDA forecast of up 12%. Census data show Oct-25 sales at 258 mil. bu. roughly 4 mil. bu. above the implied monthly inspections. In the first 2 months of the 25/26 MY exports at 533 mil. bu. are up 63% from YA.
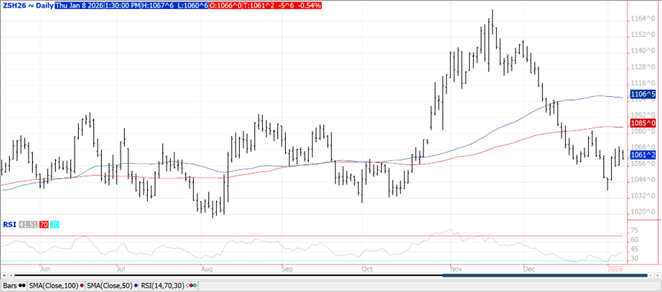
Mostly lower trade across the complex with beans down $.03-$.06 closing near session lows. Meal and oil flipped in late trade with meal $1-$2 lower while oil was up 15 points. Bean spreads weakened while products were mixed. The USDA announced a flash sale of 132k mt (5 mil. bu.) to China bringing this week’s total flash sales to 468k mt, well below the rumored total of 1-1.5 mmt. Mch-26 meal violated support at its 100 day MA. Mch-26 oil is back in its $.48-$.50 range. Spot board crush margins rose $.03 to $1.50 ½ per bu., a 2 ½ month high, while bean oil PV rose to 44.9%. The Reuters poll shows analysts expect US bean production to drop 24 mil. bu. to 4.229 bil. with the Ave yield slipping to 52.7 bpa. My production forecast is 4.235 bil. with the same yield. The Ave. guess for ending stocks at 292 mil. up only 2 mil. from Nov-26 however the range is rather wide from 245 to 350 mil. We are at 301 mil. bu. Dec. 1 stocks expected at 3.250 bil., above the 3.10 bil. YA, however below my forecast of 3.261 bil. While China’s return for US soybeans will cut into Brazilian exports, probably not enough to prevent the USDA from lowering their current US export forecast of 1.635 bil. Weekly sales at 32 mil. brought YTD commitments to 1.050 bil. down 29% from YA vs. the USDA forecast of down 13%. Sales to China at 470k tons (17 mil. bu.) brought announced YTD sales to 6.9 mmt. Flash sales this week take that total up to 7.36 mmt, still well below the 10 mmt they have been rumored to have purchased. Census data show Oct-25 sales 197 mil. bu. roughly 8 mil. bu. above the implied monthly inspections. In the first 2 months of the 25/26 MY exports at 302 mil. bu. are down 34% from YA.
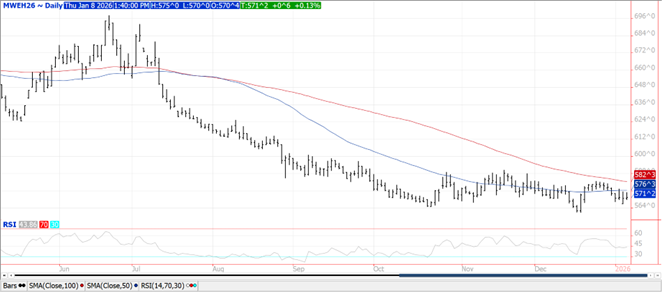
Prices weakened in late trade closing mixed and within a few cents of unchanged. Spreads also weakened. Mch-26 CGO jumped out to a 2 week high before pulling back. Mch-26 KC failed to trade above last month’s high of $5.36 ½, however held support at its 100 day MA. Dec. 1st stocks are expected to come in at 1.636 bil. above the 1.573 from YA while below my forecast of 1.656 bil. Ending stocks expected to slip 5 mil. to 896 mil. bu. Winter wheat acres are expected to drop 2% to 32.413 mil. acres which if realized would be a 6 year low. Global stocks are expected to rise 1.1 mmt to 276 mmt. Weekly exports at 4.4 mil. bu. bring YTD commitments to 739 mil. bu. up 18% from YA, vs. the USDA forecast of up 9%. Census data show Oct-25 sales 73 mil. bu. roughly 4 mil. bu. above the implied monthly inspections. In the first 5 months of the 25/26 MY exports at 440 mil. bu. are up 21.6% from YA. US winter wheat area in drought expanded another 2% LW to 42%, nearing its 52 week high of 45%.
Charts provided by CQG
Risk Warning: Investments in Equities, Contracts for Difference (CFDs) in any instrument, Futures, Options, Derivatives and Foreign Exchange can fluctuate in value. Investors should therefore be aware that they may not realise the initial amount invested and may incur additional liabilities. These investments may be subject to above average financial risk of loss. Investors should consider their financial circumstances, investment experience and if it is appropriate to invest. If necessary, seek independent financial advice.
ADM Investor Services International Limited, registered in England No. 02547805, is authorised and regulated by the Financial Conduct Authority [FRN 148474] and is a member of the London Stock Exchange. Registered office: 3rd Floor, The Minster Building, 21 Mincing Lane, London EC3R 7AG.
A subsidiary of Archer Daniels Midland Company.
© 2026 ADM Investor Services International Limited.
Futures and options trading involve significant risk of loss and may not be suitable for everyone. Therefore, carefully consider whether such trading is suitable for you in light of your financial condition. The information and comments contained herein is provided by ADMIS and in no way should be construed to be information provided by ADM. The author of this report did not have a financial interest in any of the contracts discussed in this report at the time the report was prepared. The information provided is designed to assist in your analysis and evaluation of the futures and options markets. However, any decisions you may make to buy, sell or hold a futures or options position on such research are entirely your own and not in any way deemed to be endorsed by or attributed to ADMIS. Copyright ADM Investor Services, Inc.